
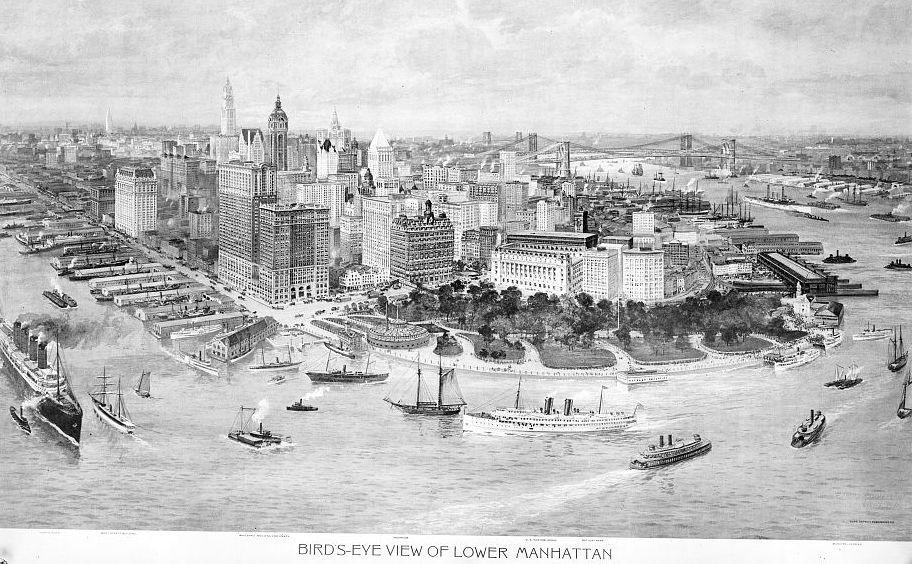
The thing about the website All The Buildings in Manhattan is that there’s not actually any new data in it. It uses information that the city government has collected and made publicly available but it does so in a way that is visually compelling.
I don’t mean that in a negative sense. Finding new ways of looking at existing data is important. We use charts that simply reproduce data in tables and we use renderings that reproduce information in plan and elevation drawings because visualization is important. It helps us to understand issues better than mere numbers; when the issues concern physical reality, a representation of that reality is always easier to understand than abstractions of it.
The bird’s-eye view of Manhattan above is, in my opinion, a version fo the same idea from 100 years ago. Before people were accustomed to air travel and before aerial photography became common, drawings like this allowed people to visualize landscapes. There’s no meaningful information in that drawing that couldn’t have been obtained from a Sanborn map but that’s not the point. The drawing allowed people to think about the built environment of Manhattan in a way that more prosaic presentations of data did not.
Whether people use the insight made available by different ways of looking is, of course, another question.
You must be logged in to post a comment.